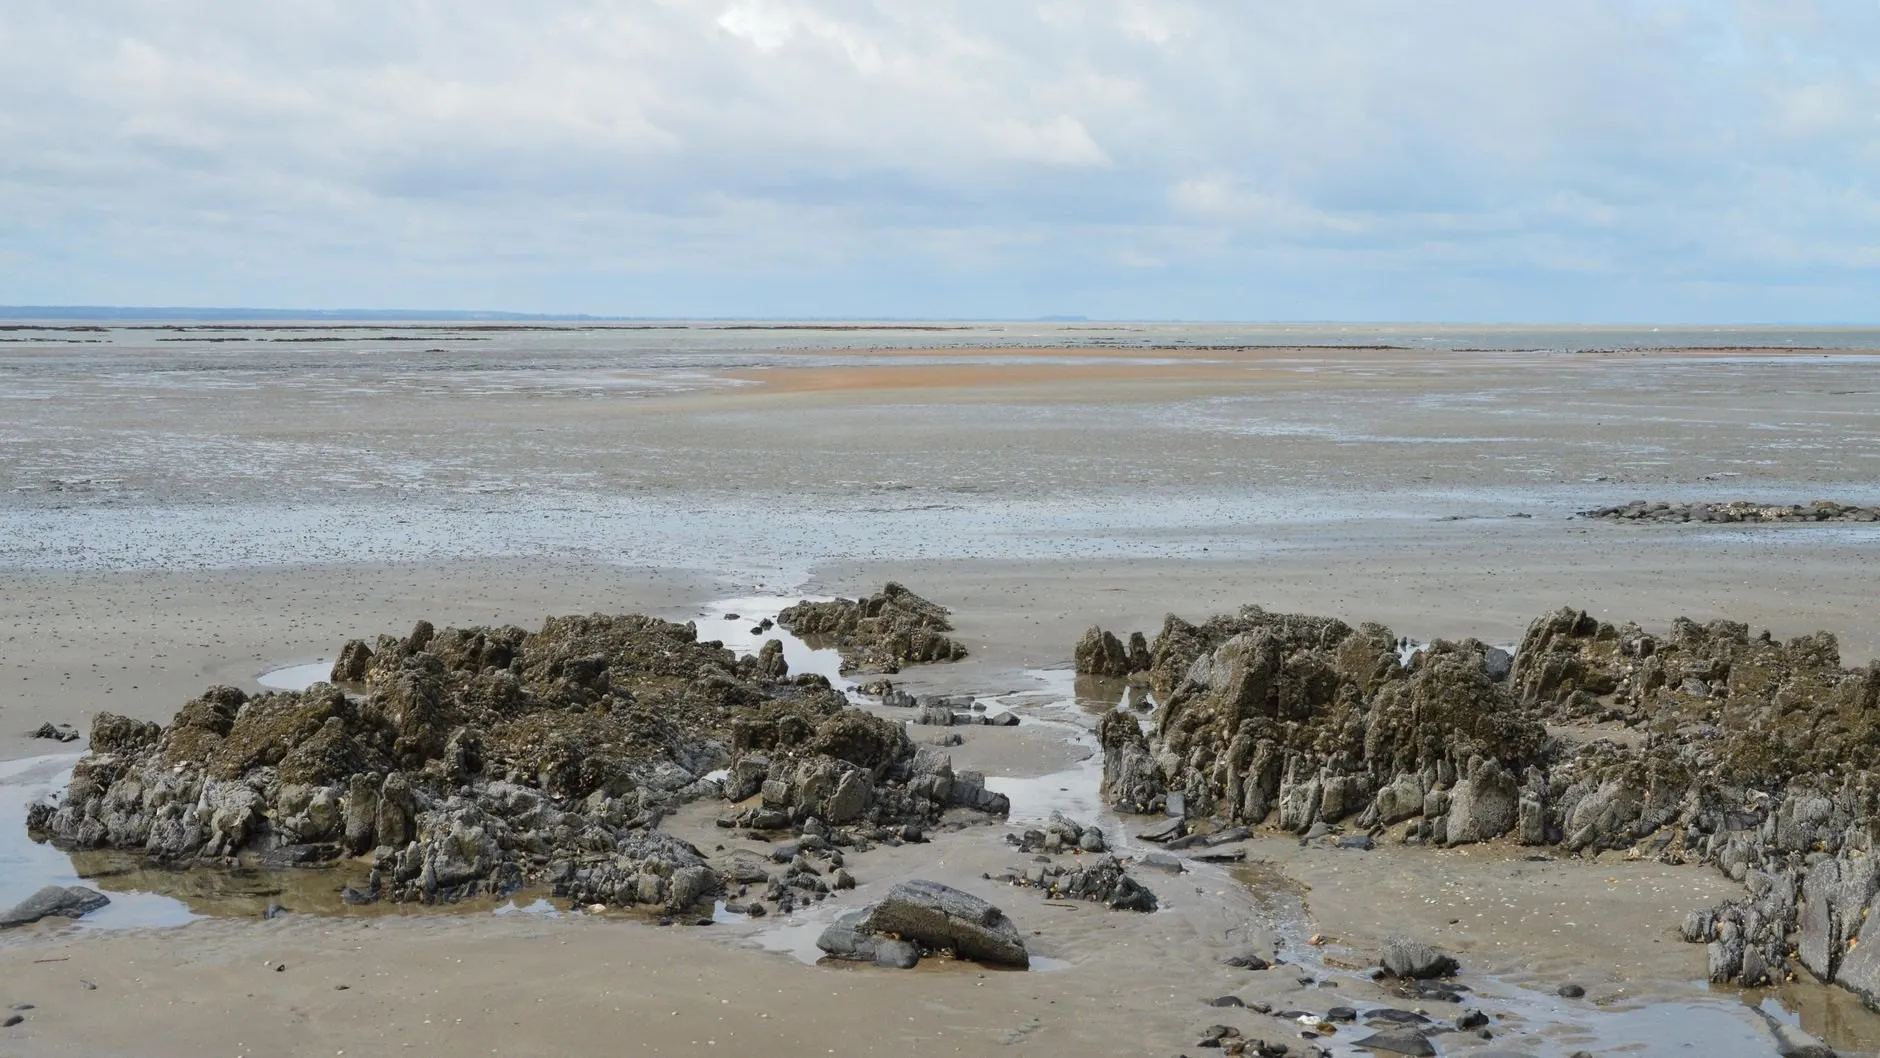
Air pressure
Roughly a centimetre of water for every millibar away from average. A deep low over the coast lifts every high and every low by 20 to 30 cm for as long as it stays.
Accuracy
A tide prediction is astronomy. The sea also has weather in it. Here is how far apart the two were at every port over the last twelve months, good days and bad.
The average is the ordinary day. The worst is the single largest gap in the year, almost always a storm.
| Port | Average error | Worst day | Neap range | Worst as share of neap range |
|---|---|---|---|---|
| Halberry Roads | 11 cm | 62 cm | 3.70 m | 17% |
| Skellow Bar | 19 cm | 94 cm | 2.54 m | 37% |
| Nethermill Reach | 23 cm | 135 cm | 3.12 m | 43% |
| Cargreave Sound | 8 cm | 35 cm | 0.82 m | 43% |
| Ossett Head | 9 cm | 48 cm | 2.14 m | 22% |
| Feltwater Ness | 14 cm | 71 cm | 0.38 m | 187% |
Read the last column twice for Feltwater Ness. On a neap there, the weather can be larger than the whole tide, and surge watch is the setting that matters.
Roughly a centimetre of water for every millibar away from average. A deep low over the coast lifts every high and every low by 20 to 30 cm for as long as it stays.
A hard onshore wind holds water against the coast: highs come in higher and lows may not arrive. Offshore does the reverse, and the reverse is the one that grounds boats.
In an estuary, river water sits on top of the tide at low water. It is why Nethermill Reach has the largest error on the list.
Surge watch, in Pro, reads the pressure and wind forecast and flags every day when they are likely to move the water by 20 cm or more, with the direction.
Measured
A tide gauge logs the water level at the port every six minutes for at least a full year.
Solved
That record is broken into eight harmonic constituents: the moon, the sun, and the shape of the coast.
Checked
Each port is re-checked against the gauge every year, and the error is published on its page.
Carried offline
The constants ship inside the app, so your phone computes any day of the year with no signal.
A full harbour analysis may carry sixty constituents. We carry eight, because eight fit offline on a phone and cover open coast well. At barred and estuary ports they do not tell the whole story, and those port pages say so.